Dysgraphia or: can a MNIST-trained ResNet read my clinically atrocious handwriting?
When I was 11 years old I was told I had a learning disability called Dysgraphia, although it’s now called “an impairment in written expression” by the DSM-5. This wasn’t a surprise given my handwriting was pretty bad, writing even the slightest bit legibly took forever, and by the 4th grade I was already starting to lose points on assignments because I’d lose track of what I had written. Thankfully, a middle school guidance counselor was reasonably well-read on it and got me an accommodation to use my laptop for notes, assignments, and tests.
Dysgraphia isn’t super well-known. It’s also, given the DSM-5 name, not well categorized yet. All that is to say, everyone’s experience of this may be different. Just in case you think I’m full of it, I’ll quote from the report of an occupational therapist who tested me when I was 15.
Standardized testing reveals significant deficits in visual motor integration (scores in the first percentile visual motor search and visual motor speed) for an individual in his age group. Standardized testing also indicates moderate deficits in 2 areas of fine motor function (fine motor precision and manual dexterity) for an individual in his age group. Deficits in these areas affect an individual’s ability to complete graphomotor tasks with adequate speed, legibility, and efficiency. Ted demonstrates rapid hand fatigue with only 8 minutes of continuous writing.
I never actually read this report until this week. I remember my mom sending it to me and my eyes glazing over after reading the first paragraph. I was a pretty unfocused kid and as long as that report let me type for standardized tests (like the SAT), then I was happy.
But hey! I’m a part of the 1%! … of the slowest hand-writers. Maybe visual motor integration changes significantly between 15 and 27 but given that the test was for adolescents and adults, I will consider it broadly applicable.
I’m not sure how to interpret 1%. If one were to have a 1st percentile IQ, they’d have an IQ of roughly 65. On the other hand, 1% is still a large population. There were 1200 kids in my high school, implying there might have been 12 other kids who wrote slower than I did. I believe there were at least 3-4 others in my high school that typed (at least for tests) so this math sort of works out.
dysgraphia is common in children with autism spectrum disorder (ASD) and/or attention deficit hyperactivity disorder (ADHD). source
The only thing I was diagnosed with while a kid was Dysgraphia which as far as I can tell isn’t super common. For one, lol. Without directly outing much more of my medical history, I’ll generally refer you back to the line where, at 15 years old, a four-page document about me specifically made my eyes glaze over.
Secondly, I’ll use this to speculate that some of those in that 1% might have had ASD, in such forms that they required different schooling, attention, or classes. In middle school and high school I was in the “default” tracked classes i.e. I wasn’t in any special needs programs, foundation-focused/remedial courses, or accelerated/honors classes. I wonder if I was simply isolated from seeing other students who struggled with this in the same way I did.
Q: Wasn’t this supposed to be a blog post about MNIST and Machine Learning?
Yeah yeah, we’re getting to it.
MNIST
Last week, I was reading the fast.ai chapter on MNIST. For the unaware, it’s a classification problem in computer vision. Given a 28x28 image of a single digit [0-9], predict the digit. They use this once-state-of-the-art model architecture called ResNet18 as an example of what’s theoretically possible with a large and well-designed model.
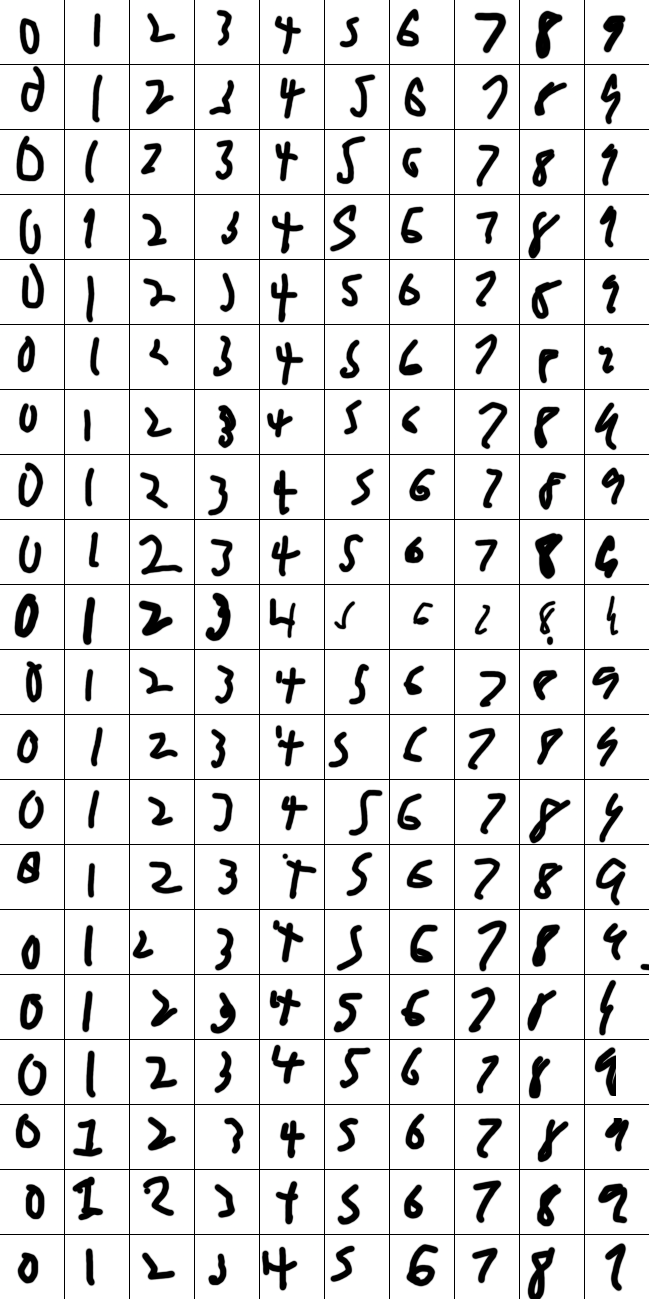
That gets me thinking, if RestNet can get ~95% accuracy, how would it do on my atrocious handwriting?

Yes, that first number is really supposed to be a 0.
So, how do I get examples of my handwriting?
Well, I shouldn’t use a mouse or a trackpad… that wouldn’t be a fair comparison to handwritten digits.
I do have an iPad though, I guess I’ll just open Goodnotes, choose a gird-ruled template, and write digits inside each box. Easy enough. The first box looks like it’s 64 pixels wide with a border of 3 pixels. Cool.
from PIL import Image
import os

large_image = Image.open('my_mnist.png')


small_image_size = 64
border_size = 3


width, height = large_image.size
num_images_x = (width + border_size) // (small_image_size + border_size)
num_images_y = (height + border_size) // (small_image_size + border_size)
for i in range(num_images_y):
    for j in range(num_images_x):
        left = j * (small_image_size + border_size)
        upper = i * (small_image_size + border_size)
        right = left + small_image_size
        lower = upper + small_image_size

        small_image = large_image.crop((left, upper, right, lower))

        resized_image = small_image.resize((28, 28), Image.ANTIALIAS)
        if i > 0.8 * num_images_y:
            dir = f"own_testing/{j}"
        else:
            dir = f"own_training/{j}"
        os.makedirs(dir, exist_ok=True)
        resized_image.save(os.path.join(dir, f'image_{i}.png'))
I can feel you judging me for how crummy that python was. This is a blog post. Get over it.
Now that we have data, let’s throw this in the fast.ai boilerplate and give it a shot.
First, let’s train the model on the standard MNIST data.
dls = ImageDataLoaders.from_folder(path, train="training", valid="testing")
learn = vision_learner(mnist_dls, resnet18, pretrained=False, metrics=accuracy)
learn.fit(3, 0.1)| Epoch | Train Loss | Valid Loss | Accuracy | Time |
|---|---|---|---|---|
| 0 | 1.265760 | 13.604419 | 0.940200 | 00:33 |
| 1 | 1.020148 | 0.664846 | 0.959800 | 00:31 |
| 2 | 1.236526 | 0.364368 | 0.978200 | 00:31 |
Alright, cool, we’re seeing good results on the standard MNIST data, let’s try validating against my examples.
learn.validate(dl=personal_dl)| Loss | Accuracy |
|---|---|
| 17.771297 | 0.0535714328289032 |
That… seems low. Let’s look at two batches and see what went wrong…
personal_dl.show_batch()
mnist_dls[0].show_batch()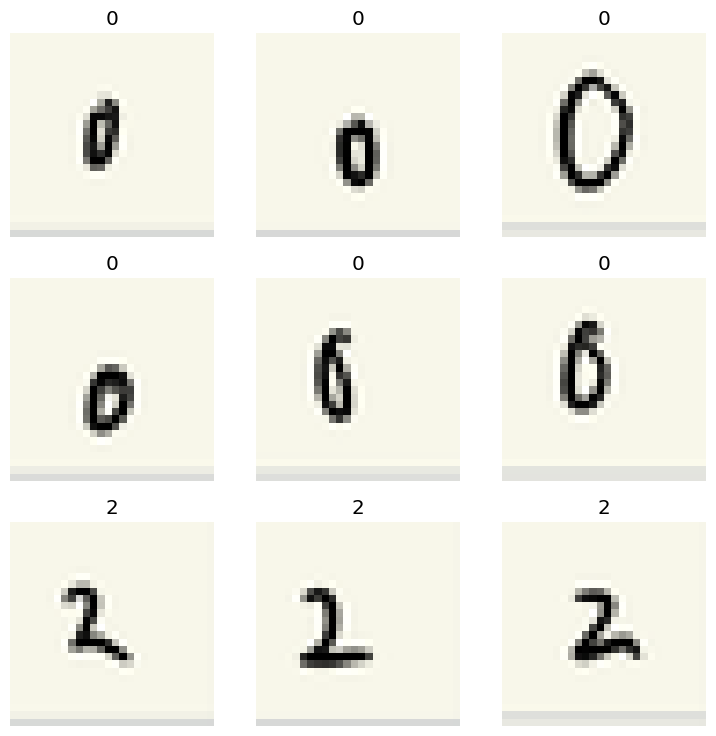
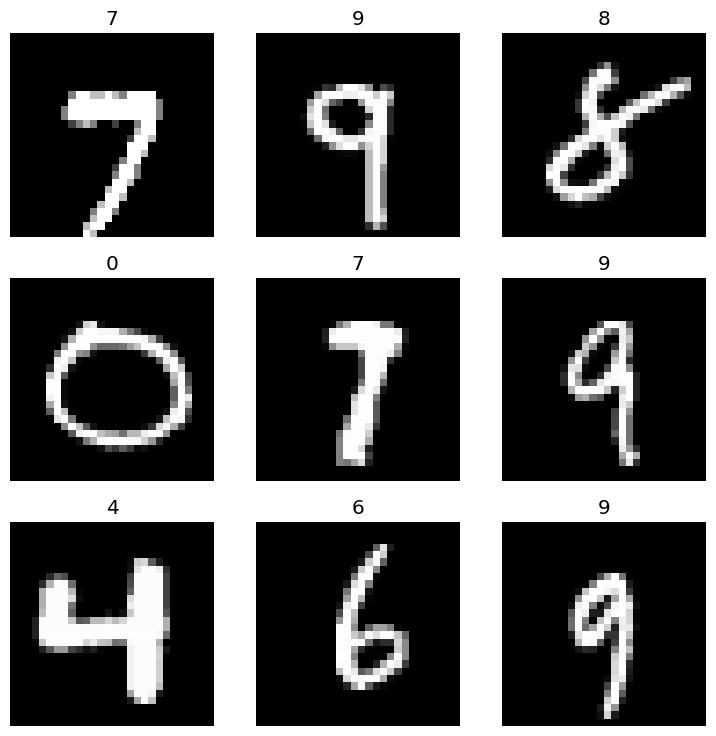
On the left, you can see a sample batch from my dataset, and the batch on the right is from the actual MNIST dataset.
So for one, I’m flipping the background and foreground colors. So let’s broadcast and subtract 1 by the array.
def convert_for_numpy(image):
    array = np.transpose(np.array(image.convert('RGB')), (2, 0, 1)) / 255
    array = 1 - array
    return array
But wait, what the heck are those grey lines on the bottom? I thought I properly handled everything being a 64x64 square with a 3-pixel border…
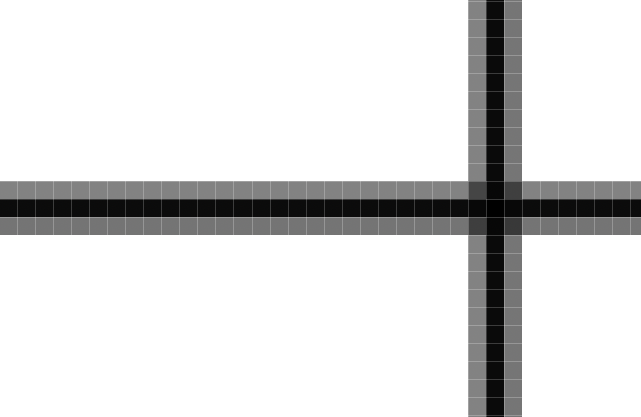
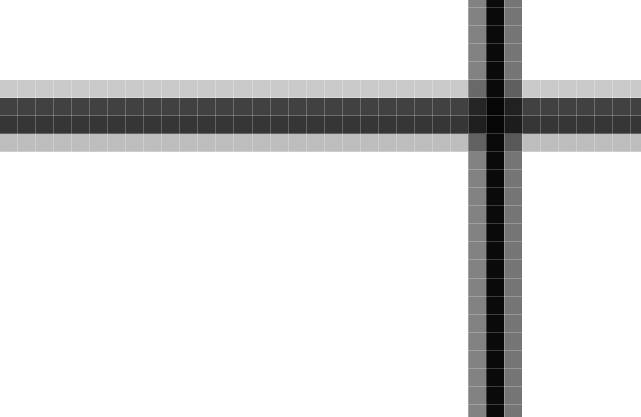
Ugh, damn it… somewhere along the way from Goodnotes, to its pdf export, to the import into Photoshop, the blurring is occurring somewhere and the lines on the grid are not a consistent width and height.
Screw it, I’m just going to directly write in Photoshop Express on my iPad. The writing and UI experience is a lot worse, there are constant screw-ups with mis-touches but at least I don’t have to manually go in and edit the image, or actually put in the effort to find where this went wrong.
Okay, finally, a decent set of data that I mostly trust.
Q: Wait, why not use an HTML Canvas like this?
Because I didn’t think of that at the time. Also, I will argue that writing a single digit in the same box over and over isn’t representative of real handwriting. A fair number of my legibility issues crop up when writing across a line. Copying slowly in the same box over and over is naturally going to be a lot cleaner and less presentative of writing across a line, across multiple lines. MNIST’s data collection was based on a form which has a mix of both. If anyone with Dysgraphia wants to start working on a dysgraphic version of the MNIST dataset, it would be fun to build a collection site for it.
Analyzing the performance
| Loss | Accuracy |
|---|---|
| 14.702737808227539 | 0.390625 |
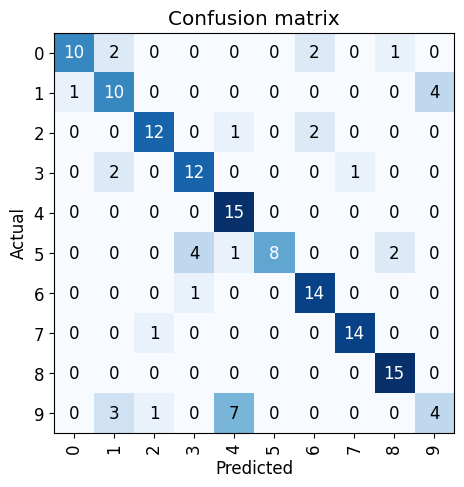
Running validate on the corrected dataset of my handwriting, we’re up to about 40% accuracy. That’s better but still not great. Although, I guess I was expecting the model to be bad. Let’s see which labels it’s having trouble with.
Shockingly, it’s able to pick up most of my 0s, however, it confuses my 1s for 6s, my 8s for 0s, and my 6s for 9s.
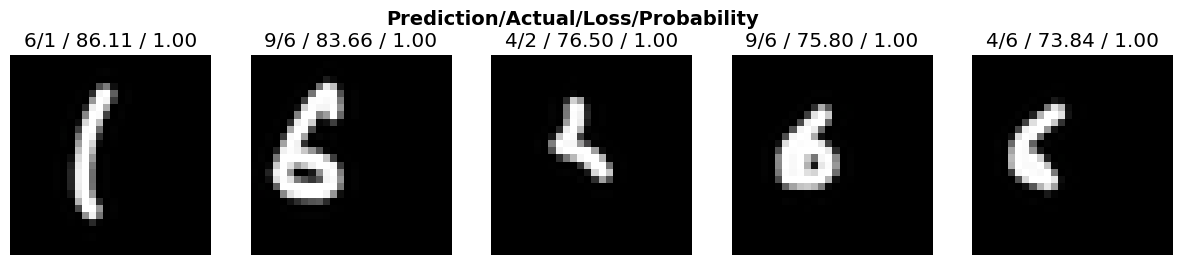
I know that softmax encourages spiky behavior when it comes to probabilities but I am shocked at just how confidently wrong these examples are. Am I really the only one (in MNIST) that draws their 1s a bit curvy?
Looking at the 6s here, the MNIST model isn’t used to seeing small digits and is roughly expecting the digit to be centered in the image. The second-most inaccurate image, that first 6, seems very much like a 6 except that it’s shifted to the left inside its box. Though, given that the shifted 6 was labelled as a 9, I could also see the model simply over-valuing that tiny blob at the top of ‘stalk’ of the 6 as being the head/top of a 9.
After seeing this, I went to the source.
The original black and white (bilevel) images from NIST were size normalized to fit in a 20x20 pixel box while preserving their aspect ratio. The resulting images contain grey levels as a result of the anti-aliasing technique used by the normalization algorithm. the images were centered in a 28x28 image by computing the center of mass of the pixels, and translating the image so as to position this point at the center of the 28x28 field. source
So yeah, this is somewhat expected. I could write more examples and manually test them based on sizing and position to verify this. That however, would require me to do more handwriting and well, fuck that. I suppose I could also just translate one particular image and look at its behavior I’m also a little suspicious of that applying generally.
I’m instead going to try to make use of data augmentation on the MNIST dataset. Maybe this is kind of weird to do for a dataset that contains images that are only 28x28 but let’s give it a shot.
Q: Why are you not just changing your dataset to match MNIST?
The model should bend to me (or not, maybe later).
Spatial Dysgraphia & Data Augmentation
My dysgraphia doesn’t just affect the accuracy of the drawing but in spacing and sizing between letters and within whatever bounds I’m writing in i.e. the size of letters change as I write and veer off the line at an angle. When you look at the examples above, know that I’m not battle-testing this model. I’m trying to write appropriately sized letters that are well spaced within the bounding box but when writing at a normal speed, I just can’t.
Below you can see examples of my handwriting when I slow down and really focus on accuracy. It is better but if I were actually writing this way I’d be there all day.

Also the MNIST dataset itself is a probably a bit biased against people with bad handwriting. Half the data in the MNIST dataset is sourced from Census writers. As Yann Lecun mentioned in his original paper, this set is a lot easier to read and I’m not sure someone like me would have been hired for a role like this back then. The other half of the samples were from high schoolers? I was unable to find any information about how these kids were selected. I’ll speculate that 1980s version of me might have been skipping class if I was getting Ds anyway. That said, I could be totally wrong.
dls = ImageDataLoaders.from_folder(
    path,
    train="training",
    valid="testing",
    batch_tfms=aug_transforms(
        mult=1.0,
        do_flip=False,
        max_zoom=1,
        min_zoom=0.6,
        size=28,
        pad_mode=PadMode.Zeros,
        xtra_tfms=[RandomResizedCrop(28, min_scale=0.9)]
    )
)
I’m turning off image flipping. It’s worth noting that some people with dysgraphia have trouble with flipping letters. I don’t and my dataset doesn’t.
I’m including zoom changes to try to capture smaller versions of digits, as well as a randomized crop that I hope will provide some level of translation handling (without cropping anything off).
So let’s see how it looks
dls[0].show_batch()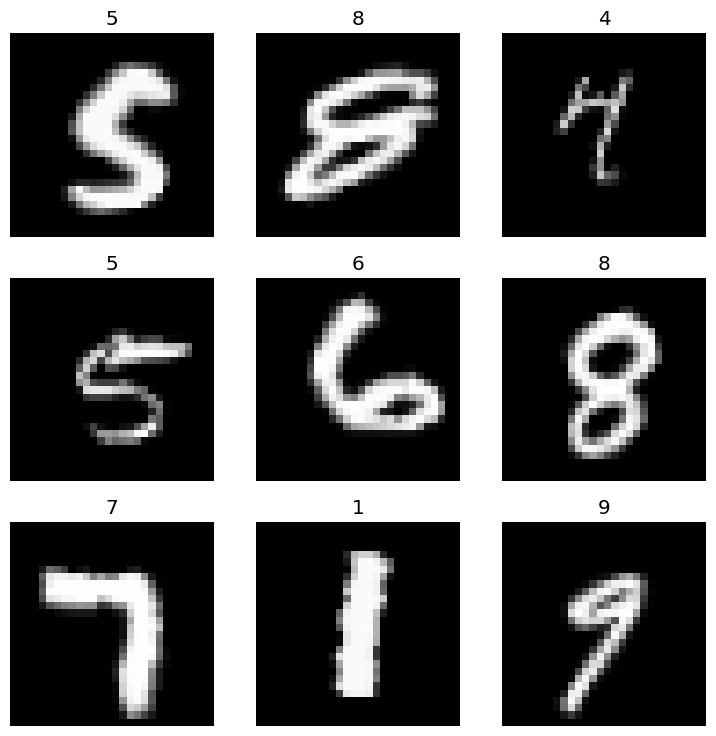
Not terrible? I ran this a few times and don’t see any obvious cropping issues. Let’s re-train on the augmented MNIST dataset and see how it goes.
| Epoch | Train Loss | Valid Loss | Accuracy | Time |
|---|---|---|---|---|
| 0 | 1.378294 | 330.915588 | 0.685100 | 00:43 |
| 1 | 1.397205 | 420.535797 | 0.905800 | 00:43 |
| 2 | 1.264168 | 0.517979 | 0.950800 | 00:43 |
| 3 | 1.640622 | 26.623316 | 0.951100 | 00:43 |
| 4 | 1.076979 | 3435.525146 | 0.953900 | 00:43 |
| 5 | 1.662939 | 17839.542969 | 0.826700 | 00:43 |
| 6 | 1.110938 | 5042323.500000 | 0.880800 | 00:43 |
| 7 | 1.572046 | 737582.562500 | 0.894600 | 00:43 |
| 8 | 1.760568 | 5991497.500000 | 0.724000 | 00:43 |
| 9 | 1.035854 | 55266.910156 | 0.924300 | 00:44 |
(Note: I probably let this bake too long and should have cut off the training earlier but the rest of the post depends on this model so oh well)
Now let’s see how well it does on my handwriting
| Loss | Accuracy |
|---|---|
| 17041.89 | 0.75 |
Woot! That’s crazy, even with garbage in I’m getting something out.
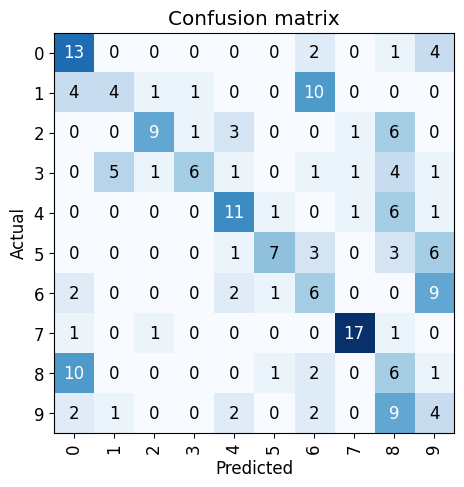
Looking at our confusion matrix again, it seem like we just have a few remaining issues.
- 1s, the model thinks a bunch of them are actually 9s (these all show up under top-losses)
- 9s apparently these get predicted as either 1s or 4s? Honestly, they are somewhat close the the traditional sail-shaped 4 so I can’t blame it too much. Also yes, my 9s do appear as sticks sometimes.
What about fine-tuning?
So I’ll save my model and recreate a new “Learner” that references my personal dataloaders as opposed to the MNIST dataloaders. There might be a better way to do this with fast.ai but I found their docs pretty frustrating. If I continue on with fast.ai’s course I think I’ll just bite the bullet and do things in Pytorch (I’ve used it for other things, the appeal of copy and past is just quite strong).
learn.save("model")
ft_learn = vision_learner(personal_dls, resnet18, pretrained=False, metrics=accuracy)
ft_learn.load("model")
# Validating the reloading the model didn't screw anything up
ft_learn.validate(dl=dls[1])
# [55266.910156, 0.924300]
ft_learn.fit(16)
Again, not the cleanest training process in the world. My dataset is also tiny so I just ran 16 epochs because just a few wasn’t doing anything.
| Epoch | Train Loss | Valid Loss | Accuracy | Time |
|---|---|---|---|---|
| 8 | 1.179394 | 2.284168 | 0.840000 | 00:00 |
| 9 | 1.158948 | 2.295619 | 0.840000 | 00:00 |
| 10 | 1.109708 | 2.283468 | 0.840000 | 00:00 |
| 11 | 1.090961 | 2.258624 | 0.840000 | 00:00 |
| 12 | 1.048456 | 2.274898 | 0.840000 | 00:00 |
| 13 | 1.062055 | 2.250582 | 0.840000 | 00:00 |
| 14 | 1.001927 | 2.265739 | 0.840000 | 00:00 |
| 15 | 1.003523 | 2.222434 | 0.840000 | 00:00 |
84% is a noticeable improvement over our prior best of 75%
Let’s see how the model is doing with the general MNIST dataset now that I’ve polluted it with my horrible handwriting style.
learn.validate(dl=mnist_dl)| Loss | Accuracy |
|---|---|
| 694622.875 | 0.8968999981880188 |
Got to love my handwriting being so bad it’s actively degrading the model. Feels good.
I know, I know, this is expected with fine-tuning. It’s probably not just my handwriting. Outside of the inherent tradeoffs to fine-tuning it’s also likely the relatively small size of the model, the size of the original training data, and my naive methods of training.
I did try Learner.fine_tunebut after 16 Epochs of mediocre accuracy improvements I was left with 80% accuracy on my handwriting and 88% accuracy on the MNIST dataset.
Data cleaning
Okay I’ve resisted modifying my dataset long enough. It’s time to use center of mass to center things and some resizing to try to match what we have for MNIST.
Let’s try something simple, let’s just center our digit in the image and run our dataset against the original, plain-old, MNIST-trained ResNet model.
from scipy.ndimage import center_of_mass, shift

def center_digit(image):
    # Assume image shape is (C, H, W), don't ask why I did this just to save this
    # to disk again
    _, height, width = image.shape

    grayscale_image = np.mean(image, axis=0)

    com = center_of_mass(grayscale_image)

    shift_y = round((height / 2) - com[0])
    shift_x = round((width / 2) - com[1])

    shifted_image = np.array([shift(channel, (shift_y, shift_x), mode='constant', cval=0) for channel in image])

    return shifted_image
Accuracy: 0.5625
Welp, okay, better than our original 40% accuracy. I suppose this increase makes sense. Although, ConvNets let us detect the same pattern anywhere in the image, the model needs to actually be trained on seeing that pattern somewhere in the image.
Also I fought with this section for way too long because I didn’t realize the pixel addition rounding was causing gaps when using shift. PITA.
Let’s get fancy. I know that my real images are 64x64, so I can crop the image to a square around it’s bounding box, and then simply resize to 20x20 (like MNIST) and add 4px of padding.
from PIL import Image, ImageOps
import numpy as np
from scipy.ndimage import center_of_mass

def process_image(image_array):
    # Ensure the array is in the format (x, y, channels), once again, don't ask
    image_array = np.transpose(image_array, (1, 2, 0))

    grayscale = np.sum(image_array, axis=-1)
    grayscale[grayscale < 0.01] = 0

    # Find the bounding box of the non-zero pixels
    rows = np.any(grayscale, axis=1)
    cols = np.any(grayscale, axis=0)
    ymin, ymax = np.where(rows)[0][[0, -1]]
    xmin, xmax = np.where(cols)[0][[0, -1]]

    cropped = image_array[ymin:ymax+1, xmin:xmax+1]

    # Create a new square image that is big enough to hold the cropped image
    size = max(cropped.shape[:2])
    new_image = np.zeros((size, size, 3), dtype=image_array.dtype)

    # Calculate the offset to center the digit
    y_offset = (size - cropped.shape[0]) // 2
    x_offset = (size - cropped.shape[1]) // 2

    new_image[y_offset:y_offset+cropped.shape[0], x_offset:x_offset+cropped.shape[1]] = cropped


    array = (new_image * 255).astype(np.uint8)
    pil_image = Image.fromarray(array)

    resized_image = pil_image.resize((20, 20), Image.ANTIALIAS)

    final_image = ImageOps.expand(resized_image, border=4, fill=0)

    return final_image
Accuracy: 0.515625
That’s annoying. This one was way, way more annoying to set up and it yielded basically no improvement over just centering everything.
This one really surprised me. I had expected the sizing to matter a lot more than just centering. Compared to centering, resizing has had basically no improvement. Weren’t the convolutional layers missing information because my strokes were too small to fit the pattern? I guess not.
Then again, cropping isn’t quite center of mass. I could be introducing some error with this method but from looking at examples it doesn’t feel significantly different.
In conclusion
ResNet still mostly sucks at reading my handwriting but not as much as before.
The biggest surprise for me is that data augmentation of MNIST provided the best accuracy results for my handwriting. I figured that my data wasn’t representative of MNIST and that sanitizing my own dataset to fit MNIST would have yielded the best results. You could say I used some intuition in deciding on the augmentation hyperparameters but outside of rotation much of the augmentation was simply trying to account for resizing which should have been handled during data cleaning. Maybe I’ll try a run where I only transform with rotation if I ever come back to this.
This has been a much longer project (about a day) than I had thought it would be. Thanks for reading if you’ve gotten this far.
I’ll end with three things,
- Dysgraphia exists
- If you’re a programmer with dysgraphia please reach out if you ever want to work on anything
- I hate whiteboard interviews where I have to physically write on a whiteboard. I’m forever thankful the pandemic killed those.